Industry Solutions
How to Estimate Solids Load Before Sizing an RAS Drum Filter and Biofilter
Learn how feed rate, peak production load, particle size, recirculation flow and solids characteristics affect drum-filter selection and downstream RAS biofilter sizing.
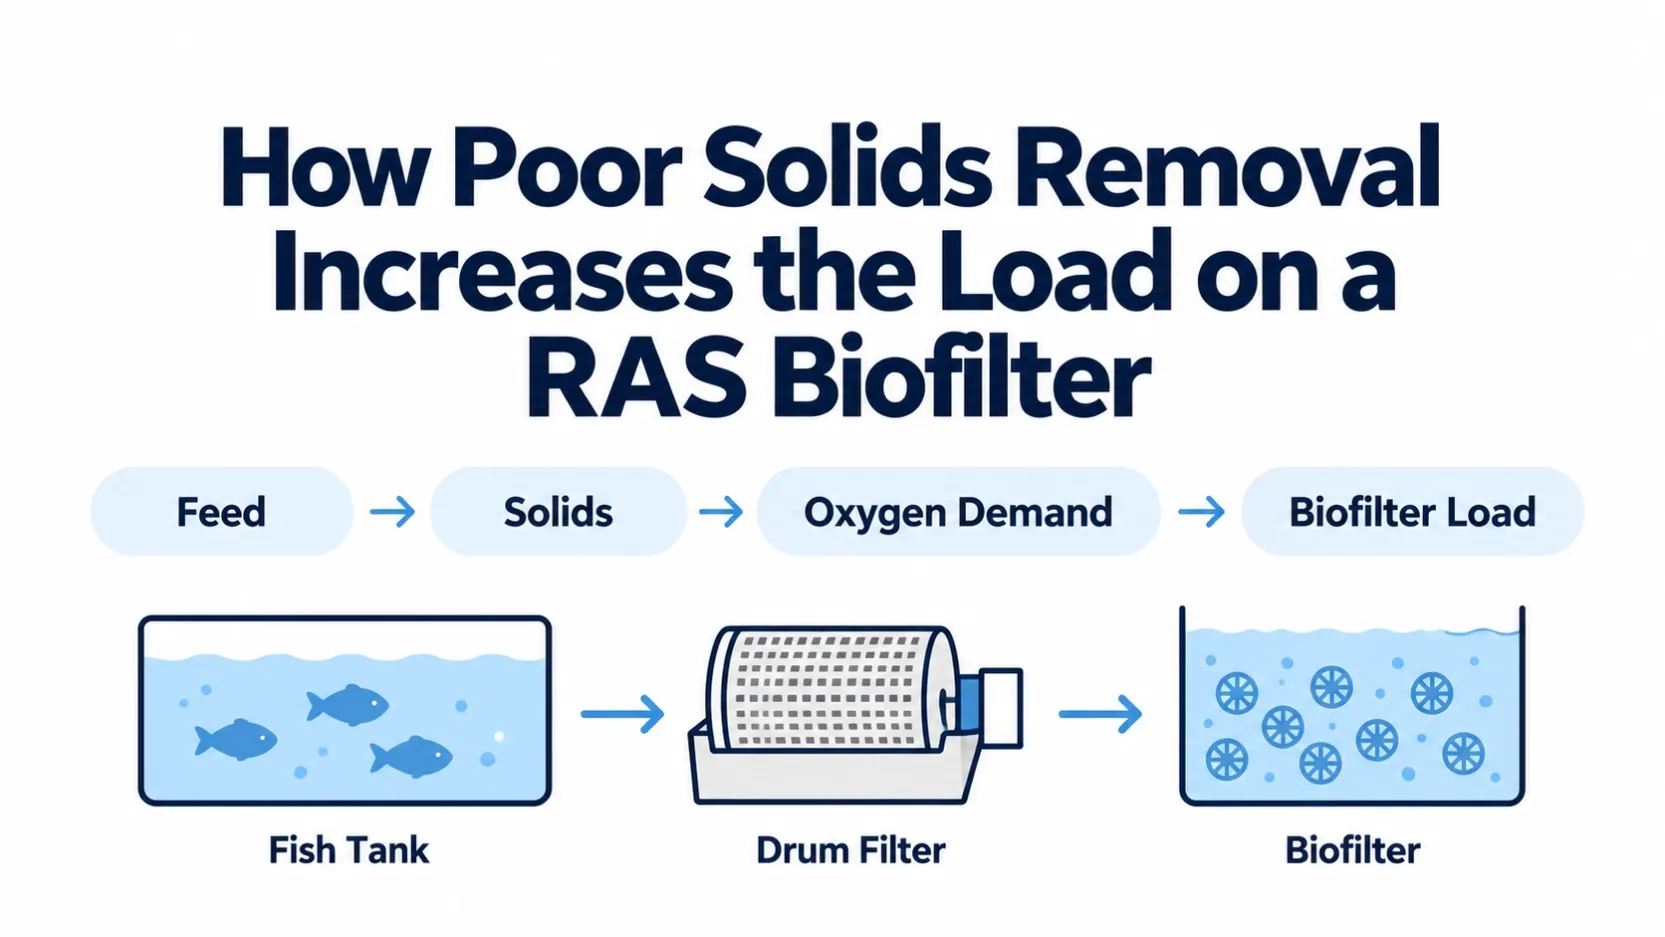
How much solids load is the RAS producing, how much must the drum filter remove, and what residual load will reach the biological stage?
Those three questions should be answered before selecting a drum-filter screen, confirming hydraulic capacity, or increasing biofilter media volume. A filter selected only from recirculation flow may pass too much particulate load downstream. A biofilter sized without considering residual solids may then experience more organic loading and oxygen demand than the biological calculation assumed.
This article provides a practical sequence for estimating solids production, defining drum-filter requirements, and checking the load that remains for the biofilter.
Why Solids Load Must Be Estimated Before Equipment Selection
Recirculation flow determines the hydraulic duty of a drum filter, but it does not describe how much waste the filter must capture. Two RAS facilities can circulate the same flow while producing very different solids loads because of differences in fish biomass, feed rate, feed quality, species, stocking density, and operating schedule.
The preliminary design therefore needs two connected checks:
- Hydraulic capacity: the maximum flow the drum filter must pass at an acceptable head loss.
- Solids capacity: the particulate load the screen and backwash system must capture and discharge during normal and peak operation.
The residual load after mechanical filtration becomes part of the organic burden on downstream treatment. This is why the drum filter and biofilter should be evaluated as one process train even though they perform different functions.
Preliminary Solids Mass Balance
Use a transparent mass balance before applying any equipment-selection table:
Produced solids load (kg/day) = feed input (kg/day) x project solids factor (kg solids/kg feed)
Captured solids load (kg/day) = produced solids load x demonstrated capture efficiency
Residual solids load (kg/day) = produced solids load - captured solids load
Peak residual load (kg/hour) = peak produced load x (1 - demonstrated peak capture efficiency)
The solids factor and capture efficiency are not universal constants. They should come from representative site measurements, a documented design basis, pilot testing, or supplier performance data for comparable operating conditions. Keep low, expected, and high cases when the inputs are uncertain.
For illustration only, if a documented project basis uses 1,000 kg/day of feed, a measured particulate-solids factor of 0.25 kg/kg feed, and 80% demonstrated capture under the design condition, the calculation is:
Item | Illustrative value |
|---|---|
Produced particulate solids | 1,000 x 0.25 = 250 kg/day |
Captured by mechanical filtration | 250 x 0.80 = 200 kg/day |
Residual particulate load | 250 - 200 = 50 kg/day |
These values are examples, not HydroNovus design coefficients. A real project must replace them with its own measured or documented inputs.
Step 1: Estimate Solids Production from Feed and Biomass
Daily feed rate is usually the most practical starting point for a preliminary RAS solids estimate. Feed introduced into the system is divided among fish growth, respiration, dissolved metabolites, uneaten feed, and particulate waste.
The design team should record:
- current and maximum fish biomass;
- average and maximum daily feed rate;
- feeding schedule and number of feeding events;
- feed type, pellet size, and fines content;
- expected feed conversion performance;
- species and production stage;
- planned production expansion.
A single average-flow figure cannot replace this production information. The filter receives the solids generated by the farm, not merely the water circulated by the pumps.
For an existing facility, operating records are more useful than generic assumptions. Compare feed input with actual sludge discharge, drum-filter backwash frequency, observed suspended solids, and accumulation in tanks or downstream equipment. These observations help test whether the preliminary solids estimate reflects real operation.
Step 2: Account for Peak Feeding and Production Load
Average daily loading can hide the periods that control equipment performance. Solids production often rises after feeding, during grading or harvesting activity, and when biomass approaches the upper operating limit.
Drum-filter selection should therefore consider both average and peak conditions. Useful questions include:
- What is the highest planned daily feed rate?
- Is feed delivered continuously or in concentrated feeding periods?
- How quickly does waste reach the mechanical filter after feeding?
- Does the recirculation system create short-duration solids peaks?
- How often can the filter backwash without disrupting hydraulic operation?
- Is additional production capacity planned within the same treatment train?
The peak case does not automatically require a larger screen opening. It may instead require more effective screen area, adequate backwash capacity, suitable water level control, or an additional unit for redundancy.
Record at least four design periods: average operating day, maximum-feed day, peak post-feeding interval, and maximum hydraulic-flow condition. If expansion is planned, add the future production case. State the duration of each peak and whether maximum solids and maximum flow occur at the same time.
Step 3: Understand Particle Size and Capture Efficiency
Not all RAS solids behave the same way. Fresh fecal material and uneaten feed can be relatively large, while pumping, fish movement, pipe turbulence, and repeated recirculation can break particles into smaller fractions.
Particle-size distribution affects how much of the produced solids a selected screen can capture. A nominal micron rating alone does not define total removal performance because capture also depends on:
- particle shape and deformability;
- screen condition;
- hydraulic loading across the screen;
- solids concentration;
- backwash frequency and pressure;
- bypass or leakage;
- time between solids production and removal.
Rapid removal matters because particles left in circulation can fragment or begin contributing to dissolved and fine organic load. The design objective is not simply clear-looking water; it is timely removal of the particulate fraction before it becomes harder to separate.
Step 4: Select Drum Filter Micron Rating and Hydraulic Capacity
A smaller screen opening can improve capture of fine particles, but it also increases resistance and may raise backwash frequency. The finest available screen is therefore not automatically the best selection.
The micron decision should be checked against:
- target particle removal;
- actual and peak recirculation flow;
- allowable head loss;
- available screen area;
- expected solids loading;
- backwash-water availability;
- spray-nozzle and pump capacity;
- downstream treatment requirements;
- maintenance access and redundancy.
For a more focused comparison of common RAS screen ratings, see 30 micron vs 70 to 75 micron Drum Filter for RAS.
Hydraulic capacity and solids capacity should be checked separately. A drum filter may pass the required water flow under clean conditions yet backwash excessively or experience unstable water levels when peak solids arrive.
Use the supplier's performance data for the proposed screen opening, effective submerged screen area, allowable head loss, and tested solids conditions. Apply the project's agreed design margin and duty/standby philosophy. Do not treat clean-water nominal flow as the final design capacity.
Where particle behavior is uncertain, collect representative samples during normal and post-feeding periods. Compare particle-size distribution and TSS before and after a candidate screen or trial device. Define acceptance criteria for residual TSS, backwash frequency, head loss, water consumption, and solids bypass before confirming the micron rating.
Step 5: Estimate the Residual Load Reaching the Biofilter
The mechanical stage will not remove every particle or dissolved compound. The design calculation should therefore estimate the portion of solids that is captured, the portion that remains suspended, and the portion that contributes to downstream organic load.
A practical mass-balance sequence is:
- Estimate total particulate production from the production and feed data.
- Define the expected capture efficiency for the selected screen under realistic operating conditions.
- Estimate captured solids and confirm that the discharge and sludge-handling systems can remove them.
- Estimate the residual particulate load leaving the filter.
- Evaluate how that residual load affects oxygen demand, biofilm competition, and downstream solids accumulation.
This is a preliminary engineering framework rather than a universal design coefficient. Pilot data, operating records, or representative wastewater testing should be used when the project requires a defensible final equipment selection.
How Solids Load Affects Oxygen Demand and Biofilter Sizing
Residual organic solids can support heterotrophic bacteria, which consume oxygen while degrading carbonaceous material. That oxygen demand exists alongside the oxygen required by nitrifying organisms.
If the residual load is higher than assumed, a biofilter can appear undersized even when its carrier volume was calculated correctly for ammonia conversion. Fine particles may also accumulate around carriers or within protected media spaces, reducing effective water and oxygen contact.
This does not mean that every ammonia problem is caused by mechanical filtration. It means the biological sizing basis should state what water quality and residual solids load are expected at the biofilter inlet.
Keep the biological checks separate. TAN loading and nitrification capacity require their own design basis, while residual carbonaceous material affects oxygen demand and heterotrophic growth. Confirm oxygen transfer using measured or specified influent load, temperature, salinity where relevant, target dissolved oxygen, aeration performance, and the expected residual organic load. Do not convert residual particulate mass directly into oxygen demand without project-specific COD/BOD or respirometry data.
When an existing system has unstable ammonia or nitrification, use How Poor Solids Removal Reduces Biofilter Performance in RAS as the deeper troubleshooting guide. If tank volume is the confirmed limitation, see How to Increase Biofilter Capacity in an Existing RAS Without Expanding Tank Volume.
Mechanical and Biological Sizing Sequence
A combined preliminary sizing workflow is:
- Define fish biomass, species, production stage, and feed profile.
- Establish average and peak recirculation flow.
- Estimate average and peak particulate production.
- Review particle-size distribution and required capture performance.
- Select a preliminary screen opening and verify hydraulic screen area.
- Check backwash demand, solids discharge, and redundancy.
- Estimate the residual load after mechanical filtration.
- Calculate biological ammonia and organic loading.
- Confirm oxygen-transfer, mixing, media-retention, and reactor-volume requirements.
- Review the full process under peak production conditions.
This sequence prevents the biofilter calculation from being isolated from the mechanical conditions that determine its inlet load.
The preliminary equipment schedule should record design flow, peak solids load, selected screen opening, effective screen area, allowable head loss, expected backwash demand, design margin, and operating/standby configuration. Final selection should be reconciled with the drum-filter supplier's tested performance envelope.
Project Data Required for Combined Drum Filter and Biofilter Sizing
Hydraulic Data
- normal and maximum recirculation flow;
- number of operating and standby filter units;
- available water-level difference and allowable head loss;
- pump operating range;
- bypass arrangement and emergency flow path.
Production Data
- fish species and production stage;
- current and design biomass;
- average and maximum feed rate;
- feeding schedule;
- planned production increase.
Solids Data
- suspended-solids measurements where available;
- observed particle-size distribution;
- feed fines and uneaten-feed conditions;
- sludge discharge volume and frequency;
- screen fouling and backwash history;
- visible downstream accumulation.
Biofilter Data
- TAN and nitrite loading;
- water temperature, pH, and alkalinity;
- dissolved oxygen at the biofilter inlet and outlet;
- existing reactor volume;
- media type, quantity, and fill ratio;
- aeration and mixing arrangement;
- operating ammonia and nitrite trends.
RAS Sizing and Troubleshooting Table
Observation | Possible solids-related cause | Data to check |
|---|---|---|
Drum filter backwashes continuously | Peak solids load or insufficient effective screen area | Feed timing, peak flow, screen condition, backwash settings |
Water level rises across the screen | Excess hydraulic or solids loading | Actual flow, head loss, blocked screen area, bypass condition |
Fine solids accumulate downstream | Screen opening or capture conditions do not match particle distribution | Particle size, screen integrity, hydraulic loading, backwash performance |
Biofilter dissolved oxygen falls | Residual organic load increases oxygen consumption | Inlet solids, COD/BOD indicators, aeration output, feed load |
Ammonia rises after feeding | Peak biological and organic loads exceed available capacity | Feed schedule, TAN trend, dissolved oxygen, residual solids |
Adding media gives limited improvement | Mechanical, oxygen, or hydraulic limitation remains unresolved | Solids capture, mixing, oxygen transfer, usable reactor volume |
Common Sizing and Troubleshooting Mistakes
- Selecting a drum filter from flow rate alone.
- Using average feed load without checking peak production conditions.
- Assuming the smallest micron rating is automatically best.
- Ignoring backwash-water and solids-discharge capacity.
- Treating screen opening as a guaranteed capture-efficiency value.
- Calculating biofilter media volume without defining inlet solids and oxygen conditions.
- Adding biological media before checking mechanical-filter bypass, screen condition, and actual flow.
- Using theoretical carrier surface area without confirming mixing and mass transfer.
FAQ
Does a drum filter remove ammonia?
No. A drum filter removes particulate solids. Ammonia is handled mainly by biological treatment, but effective particulate removal can reduce the organic burden and oxygen competition entering that biological stage.
Should an RAS always use the finest possible drum-filter screen?
No. The screen must balance particle capture, hydraulic capacity, head loss, backwash demand, and downstream treatment requirements. A finer screen can create operational problems if the available screen area or cleaning system is inadequate.
Can adding more biofilter media correct high residual solids load?
Not by itself. More carrier area may address a confirmed biological-area limitation, but it does not repair poor solids capture, inadequate oxygen transfer, bypass, or unsuitable hydraulics.
What information is most important before sizing a drum filter?
Maximum recirculation flow, average and peak feed rate, fish biomass, particle-size behavior, expected solids production, target capture performance, allowable head loss, and backwash conditions are the core inputs.
Why use peak load instead of average load alone?
Short-duration solids and feed peaks can control backwash demand, water-level stability, oxygen consumption, and ammonia response. Equipment that appears adequate at the daily average may still be unstable during those operating periods.
Preliminary Biofilter Sizing Checkpoint
After calculating residual solids, keep ammonia conversion and carbonaceous oxygen demand as separate checks.
TAN load (kg/day) = feed input (kg/day) x documented TAN factor (kg TAN/kg feed)
Required protected area (m2) = TAN load (g/day) / documented surface removal rate (g TAN/m2/day)
Required media volume (m3) = required protected area / verified protected area (m2/m3 media)
Required reactor volume (m3) = media volume / selected fill fraction
For illustration only, suppose a documented project basis uses 1,000 kg/day feed, 0.03 kg TAN/kg feed, a verified design rate of 0.5 g TAN/m2/day, 800 m2/m3 verified protected area, and a 50% fill fraction:
Check | Illustrative result |
|---|---|
TAN load | 1,000 x 0.03 = 30 kg/day |
Required protected area | 30,000 / 0.5 = 60,000 m2 |
Required media volume | 60,000 / 800 = 75 m3 |
Required reactor volume | 75 / 0.50 = 150 m3 |
These numbers are not product guarantees or HydroNovus design coefficients. Replace every factor with project-specific measured data, the selected media's documented performance basis, temperature and water-quality corrections, and an agreed design margin. Then check whether oxygen transfer can support nitrification, residual carbonaceous demand, and background respiration at the required dissolved-oxygen condition.
Candidate Drum Filter Acceptance Check
Criterion | Project requirement | Vendor-tested value | Decision |
|---|---|---|---|
Peak hydraulic flow | Enter value in m3/hour | Enter tested value | Pass/Fail |
Peak solids load | Enter value in kg/hour | Enter tested value | Pass/Fail |
Screen opening | Enter target micron rating | Enter supplied rating | Pass/Fail |
Allowable head loss | Enter maximum | Enter tested head loss | Pass/Fail |
Backwash demand | Enter available flow and pressure | Enter required flow and pressure | Pass/Fail |
Design margin | Enter agreed margin | Show available margin | Pass/Fail |
Redundancy | Enter duty/standby requirement | Enter proposed arrangement | Pass/Fail |
A candidate should not pass unless both peak hydraulic flow and peak solids load remain within the supplier's tested envelope after applying the agreed design margin.
Project Sizing Input Worksheet
Input | Value | Units | Source and date | Confidence | Design case |
|---|---|---|---|---|---|
Fish biomass | | kg | | | Average/Peak/Future |
Feed rate | | kg/day | | | Average/Peak/Future |
Peak interval | | hours | | | Peak |
Recirculation flow | | m3/hour | | | Average/Maximum |
Particulate-solids factor | | kg/kg feed | | | Low/Base/High |
Screen capture efficiency | | percent | | | Normal/Peak |
Residual TSS | | mg/L | | | Target/Measured |
TAN load | | kg/day | | | Average/Peak |
Biofilter dissolved oxygen | | mg/L | | | Inlet/Outlet |
For background on mass balances, solids removal, and biological filtration in recirculating systems, consult the FAO technical guidance on small-scale aquaponic food production and reconcile its general principles with the current project data and equipment supplier's tested information.
Evidence and Design Boundaries
Use measured site data wherever possible. Literature values can support early screening, but they should be identified as assumptions and replaced before final equipment selection. Supplier guarantees should state the tested flow, screen opening, solids characteristics, head loss, and cleaning conditions. Engineering judgment should be documented separately from measured or guaranteed inputs.
If you are selecting a drum filter or checking whether an existing biofilter is receiving excessive solids load, send the current flow, feed, biomass, screen, water-quality, and biofilter data for a combined review.